Our brain activity is constantly fluctuating as we engage in different activities on a daily basis. In fact, the brain is quite active even while we are resting with our eyes closed. fMRI is a safe and non-invasive neuroimaging tool that plays quite an essential role in understanding brain activity and brain function. The discovery that a change in neuronal activity is associated with a change in local blood flow patterns which in turn leads to a change in blood’s magnetic properties is the fundamental idea behind how fMRI works.1 The YouTube video made by the Beckman Institute at UIUC is a useful first introduction to what an fMRI does.
Blood Oxygen Level Dependent (BOLD) signal
Brain function requires glucose as an energy source. Hemoglobin transports oxygen to the brain which is required for glucose metabolism (which in turn releases energy). Regional brain function leads to blood flow which in turn changes the amount of oxygen in the neighborhood i.e. the local magnetic field is perturbed. This change in the amount of oxygen, induced by neural activity, gives rise to the BOLD signal. A detailed description is given in the next paragraph.
- In 1931, Linus Pauling discovered that the magnetic properties of hemoglobin in oxygenated and deoxygenated blood are different.2
- Oxygenated hemoglobin is diamagnetic (individual atoms have no magnetic moment hence there is no net magnetic moment).
- Deoxygenated blood is paramagnetic (atoms have random magnetic moment directions, hence a net magnetic moment).
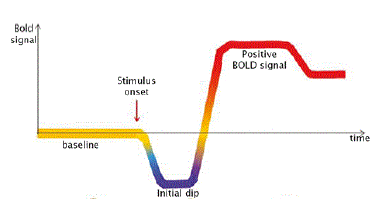
- When there is neuronal activity, there is an initial local oxygen consumption which means that deoxyhemoglobin concentration increases locally. This leads to a decrease in BOLD signal called initial dip or fast response.
- However, due to the increase in demand for oxygen, an increased blood flow is observed in order to increase the concentration of oxygenated hemoglobin locally.
- After a few seconds, delivery of oxygenated hemoglobin exceeds the demand which increases local oxygenated hemoglobin concentration significantly ($\approx$ 1 to 3 % above baseline). This gives rise to a BOLD signal that is much stronger than the initial dip.
Therefore, the BOLD signal can be interpreted as an indirect way of quantifying regional neuronal activity.
Macroscopic picture of MR
BOLD imaging is the most common method of fMRI.3 BOLD MRI is also called fMRI. Magnetic resonance is the absorption or emission of electromagnetic radiation by atomic nuclei in response to certain magnetic fields.4 A couple of useful video resources to get introduced to fMRI are:
- MRI Physics education materials, Body MRI Research group, Stanford Medicine
- MRI Physics, Johns Hopkins Radiology
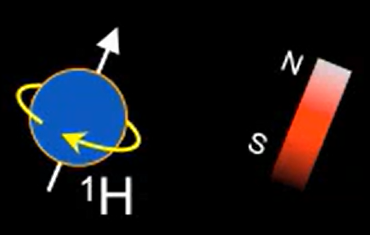
- First of all, the fMRI scanner constitutes a large magnet with its magnetic field $B_0$. Free protons or $H^+$ are the most widely imaged due to the abundance of water in the human body. These $H^+$ ions act like a bar magnet with a positive and a negative pole.
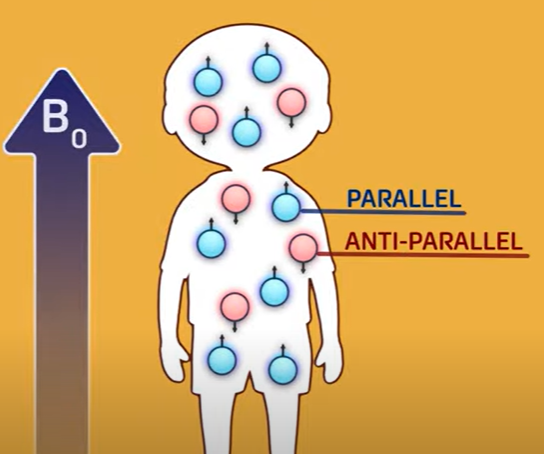
- The orientation of these protons (as a magnet) is generally random but can be influenced by the field $B_0$ associated with the MR scanner. The protons align parallel or antiparallel to the magnetic field $B_0$. However, a small majority of the protons align with the direction of $B_0$. This gives rise to a net magnetization vector in the direction of $B_0$.
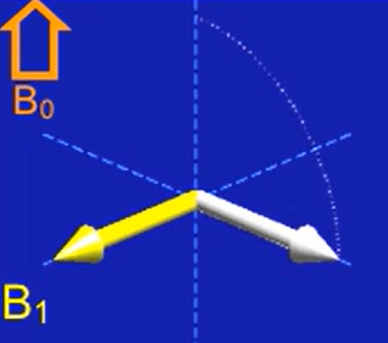
- In the picture below, the white vector denotes the net magnetization vector in the direction of $B_0$. Using a radiofrequency pulse $B_1$, called excitation, we can “tilt” the net magnetization vector to be perpendicular to $B_0$.
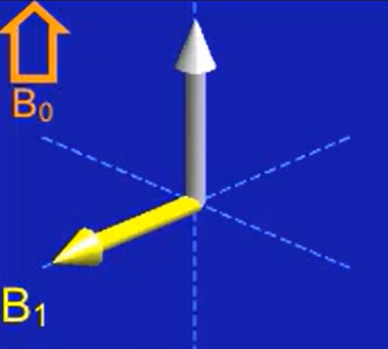
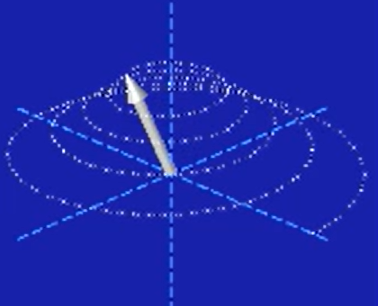
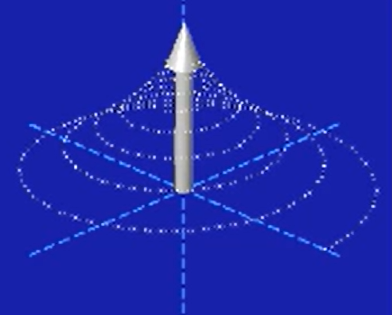
- Once the net magnetization vector is tilted, it spirals (around the $B_0$ direction) back to the original direction (i.e. parallel to $B_0$). This induces an electrical signal which follows from the Ampere’s right-hand rule.
Microscopic picture of MR
At the level of a single proton, each proton precesses about its axis. Hence, each proton is associated with a magnetic moment vector parallel to proton’s axis of precession. Consider a tissue sample in the absence of an external magnetic field. The magnetic moments of protons in the sample are oriented randomly. This leads to a net zero magnetic moment for the tissue sample.
In the presence of a radiofrequency (RF) signal (shown below in red), the proton begins to precess in a different direction and with an angle (w.r.t the axis) that depends on the strength and duration of the RF pulse. Therefore, at the level of multiple protons, we initially start with protons precessing about their axis and out of sync in such a way that the net magnetization is parallel to $B_0$ since the number of protons precessing parallelly is slightly more than that of the anti-parallel protons. This leads to a net longitudinal magnetization parallel to $B_0$. However, after excitation (i.e. RF pulse)
- some protons reverse their precession directions so that there is no net longitudinal magnetization.
- all the protons process in phase temporarily.
This brief synchronization of precession gives the net transverse magnetization.
However, this synchronization is temporary i.e. the protons recover to their original state of disorder, which is out of phase precession with net magnetization in the direction of $B_0$. Hence the transverse signal decays and the longitudinal signal recovers. This decay will look like a spiraling of the net magnetization vector about the $B_0$ direction. (as shown in the picture in point four) This recovery is also called relaxation.
Remarks
- The frequency of precession ($f_0$), described by the Larmor equation, depends on the strength of magnetic field $B_0$. The gyromagnetic ratio $\gamma$ is a constant that is unique to each nucleus. \(f_0 = \gamma B_0\)
- The point at which $63\%$ of the longitudinal magnetization is recovered is called T1 time.
- The time at which $63\%$ of the transverse magnetization is lost is called T2 time.
- The T1 and T2 times are unique to each tissue type image.
Image formation in fMRI
-
What is fMRI?, Oxford Centre for Functional MRI of the Brain ↩
-
Ramani, Ramachandran (ed.), Functional MRI: Basic Principles and Emerging Clinical Applications for Anesthesiology and the Neurological Sciences, 1 (New York, 2018; online edn, Oxford Academic, 1 Jan. 2019) ↩
-
Owen J. Arthurs, Simon Boniface, How well do we understand the neural origins of the fMRI BOLD signal? - Trends in Neurosciences, Vol 25 Issue 1 ↩
-
Britannica, The Editors of Encyclopaedia. “magnetic resonance”. Encyclopedia Britannica, 25 Jan. 2011. Accessed 24 June 2023. ↩