Approximately three years ago, when I first began exploring topological data analysis, I struggled to appreciate the advantages of the Delaunay complex over the Rips complex. I have noticed that within the TDA community, those with a stronger mathematical background tend to prefer Delaunay complexes over Rips complexes when working with data in $\mathbb{R}^d$ for $d \in \lbrace 1, 2, 3 \rbrace$. In contrast, people with an applied background such as statistics or data science, including myself, often find Rips complexes easier to grasp at first, and Delaunay complexes can feel too geometric or abstract to work with comfortably. In this post, I want to share my newfound appreciation for the Delaunay complex and Voronoi tessellations in data analysis. This blog assumes basic familiarity with Voronoi tessellations, Delaunay complexes and Alpha complexes. One of my earlier blogs titled “Simplicial Complexes” introduces some of the required basics. First section gives a more detailed introduction to Voronoi tessalations followed by a section focused on the mathematical duality connecting Delaunay and Voronoi complexes. The final section will focus on Alpha and Voronoi filtrations, along with an explanation on how to interpret these objects in the context of data analysis. A detailed explanation of the Voronoi-Delaunay duality is provided in the lectures notes of a course at ETH Zurich 1. The information in the blog is a combination of the references listed at the end of the blog.
Voronoi tessellations
Voronoi tessellations are geometric objects that encode proximity information about a point set of interest. They are among the oldest geometric complexes to be studied and have been rediscovered at different times under different names, such as Dirichlet tessellations, Thiessen polygons, and Wigner–Seitz cells. However, the name Voronoi tessellations comes from the mathematician Georgy Voronoi, who studied the general $n$-dimensional case of this object. Some of the applications of Voronoi diagrams include crystal formation, meteorology, modelling animal territories and computational chemistry23.
Let $S$ be a finite point set in $\mathbb{R}^d$. Then the Voronoi cell of a point $p \in S$, denoted by $\mathcal{V}(p)$, is defined as the set of all points in $\mathbb{R}^d$ that are closer to the point $p$ than any other point in $P \setminus \lbrace p \rbrace $.
\[\mathcal{V}(p) = \lbrace q \in \mathbb{R}^d \text{ } : \text{ } d(q, p) \leq d(q, p') \text{ for all } p' \in P \setminus \lbrace p \rbrace \rbrace\]Union of closure of Voronoi cells is a well-defined cell complex called Voronoi diagrams. In fact, Voronoi diagrams are special kind of cell complexes called polyhedral complexes. As the name suggests, the cells of a polyhedral complex $\mathcal{C}$ are polyhdrons that satisfy:
- every face of a cell in $\mathcal{C}$ also belongs to $\mathcal{C}$.
- the intersection of any two cells in $\mathcal{C}$ is either empty or a common face of both cells.
While working with Voronoi diagrams, the points in $S$ are assumed to be in general position since it ensures some “nice” geometric properties for the Voronoi diagram and its dual that is discussed in the next section. The point set $S \subseteq \mathbb{R}^d$ is said to be in general position of the following two conditions hold:
- No combination of $d+2$ points in $S$ are cospherical i.e. the points lie on a $d$-sphere.
- No combination of $d+1$ points in $S$ are affinely dependent. This corresponds to $3$ collinear points in $\mathbb{R}^2$ and $4$ coplanar points in $\mathbb{R}^3$.

Delaunay Complex
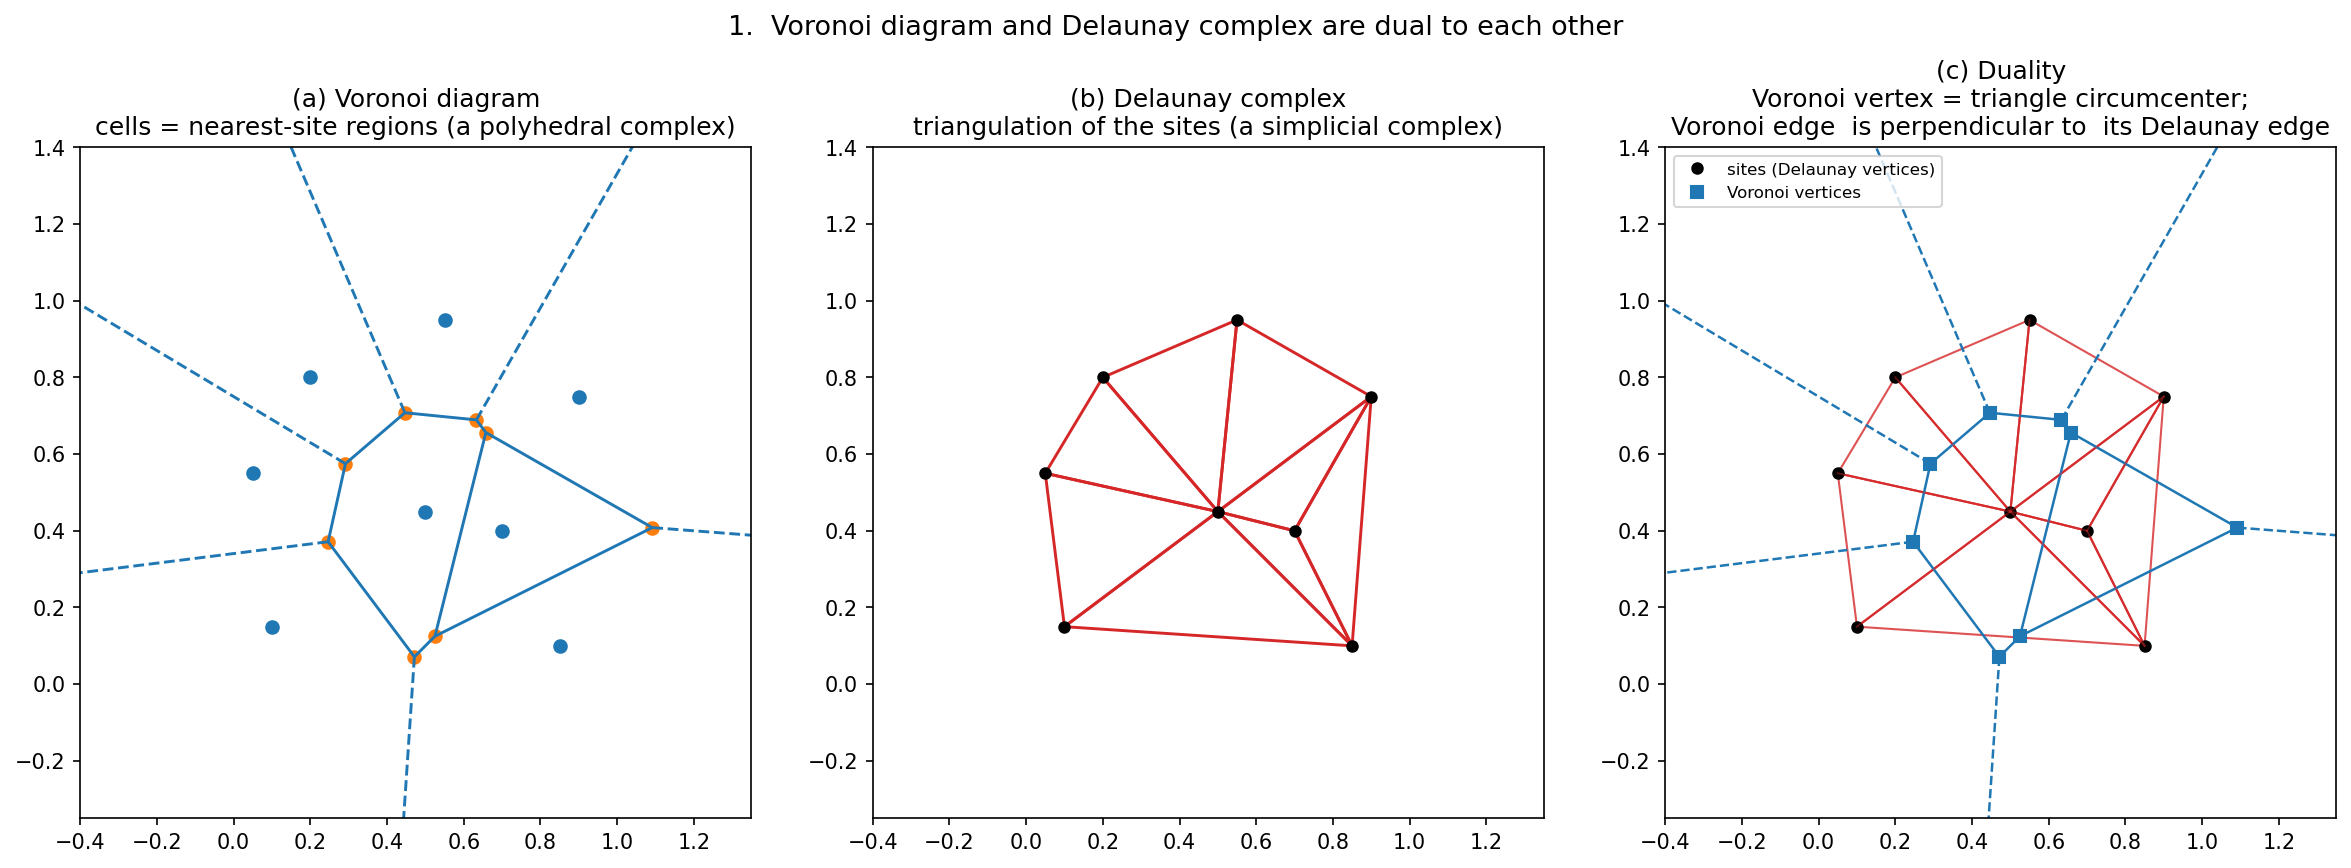
Delaunay complex associated with a dataset $P$, denoted by $Del(P)$, is defined as the combinatorial dual of the Voronoi tessellation $\mathcal{V}(P)$. There is a one-to-one correspondence between the $k$-cell (simplex) of $Del(P)$ and $(d-k)$-cell of $\mathcal{V}(P)$. This is easier to visualize when $d=2$ where the following correspondence holds:
| Delaunay cell | dual Voronoi cell | in $\mathbb{R}^2$ |
|---|---|---|
| vertex or site $p_i \in Del(P)$ | region $V(p_i) \in \mathcal{V}(P)$ | $0 \leftrightarrow 2$ |
| edge $(p_i, p_j) \in Del(P)$ | shared Voronoi edge $V(p_i) \cap V(p_j)$ | $1 \leftrightarrow 1$ |
| triangle $(p_i, p_j, p_k) \in Del(P)$ | shared Voronoi vertex $V(p_i) \cap V(p_j) \cap V(p_k)$ | $2 \leftrightarrow 0$ |
Note that the canonical Delaunay complex (the one defined as the dual of the Voronoi diagram, i.e. the Delaunay subdivision) is not a simplicial complex when the points fail to be in general position. It is still a polyhedral complex, but some of its top cells are non-simplicial polygons (quadrilaterals, pentagons, …) instead of triangles.
The unifying object: the distance function
References
-
Gärtner, B., Hoffmann, M., Schnider, P., & Welzl, E. (2025). “Geometry: Combinatorics & Algorithms Lecture Notes” HS 2024 (course website: https://ti.inf.ethz.ch/ew/courses/Geo24/index.html). ETH Zürich. ↩
-
University of Bristol, School of Mathematics. “What is a Voronoi diagram?” Fry Building Public Art Strategy. University of Bristol. ↩
-
Tamal K. Dey. “Voronoi diagrams” Lecture, CS 531: Computational Geometry, Fall 2024. Purdue University, West Lafayette, IN. ↩